
In this article we explain the functions of the Commodity tab.
The commodity tab provides an overview of an industry, as well as the detailed analysis of events that impact a commodity and the companies involved with it both historically and in real time.
To start working with this page you need to follow a commodity of interest. Once you follow a collection it will appear in the “My Collection” list and you can see the overview.

Once you follow a collection it will appear in the commodity tab. The functionality of the commodity tab explained below.
Left Sidebar
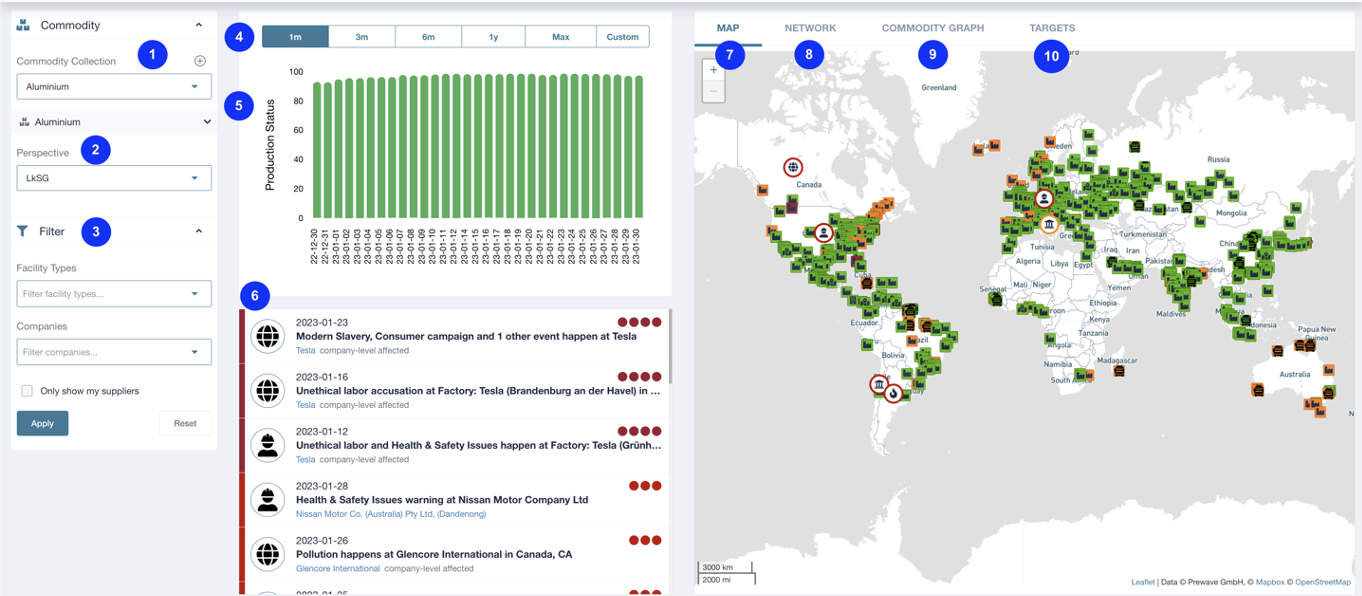
- Commodity collection: This filter is used to select a commodity for analysis. Once a commodity has been selected its subcategories will also be visible. The subcategories can be expanded using the arrows. Selecting a subcategory will filter the information displayed to only show what is relevant to the subcategory.
- Perspectives filter the alerts shown on the page. Production Status is linked to the disruption perspective and is therefore suggested to use in the Commodity tab.
- Filter options allow to display the results on a specific type of facility, such as factories or offices or for a company of choice. Either by selecting from the dropdown menu, or by using the search field.
- Period: This filter allows the user to adapt the period for which the alerts on the right-hand side should be shown.
- Production Capacity chart: Shows Production Status of the commodity during the selected period. Clicking on one of the bars in the chart shows only the alerts for the period specified underneath the selected bar.
- Alerts: The list of events related to the chosen commodity which contributed to the Production Status statistics. Each alert is clickable. More information on the alert structure can be found here.
- Map: The map displays all the targets which have been affected by an alert within the selected timespan. The targets are colour coded according to their status (active = green, at risk = yellow, inactive = red). The map also displays the latest critical alerts in different areas.
- Network: Shows the connection between the entities involved with this commodity and other targets in Prewave. Works only in case the Tier-N mapping is activated and available for selected targets. :
- Commodity graph: Displays the structure of the commodity down to the raw components.
- Targets: List of every company included in the commodity production as well as their current disruption status. Clicking on any of these entities will display a historical list of alerts.