This article describes how to work with the live risk analysis function in Prewave.
How to find the live analysis:
To enter the risk analysis Tab click on the "Analysis" Symbole in the main navigation menu.

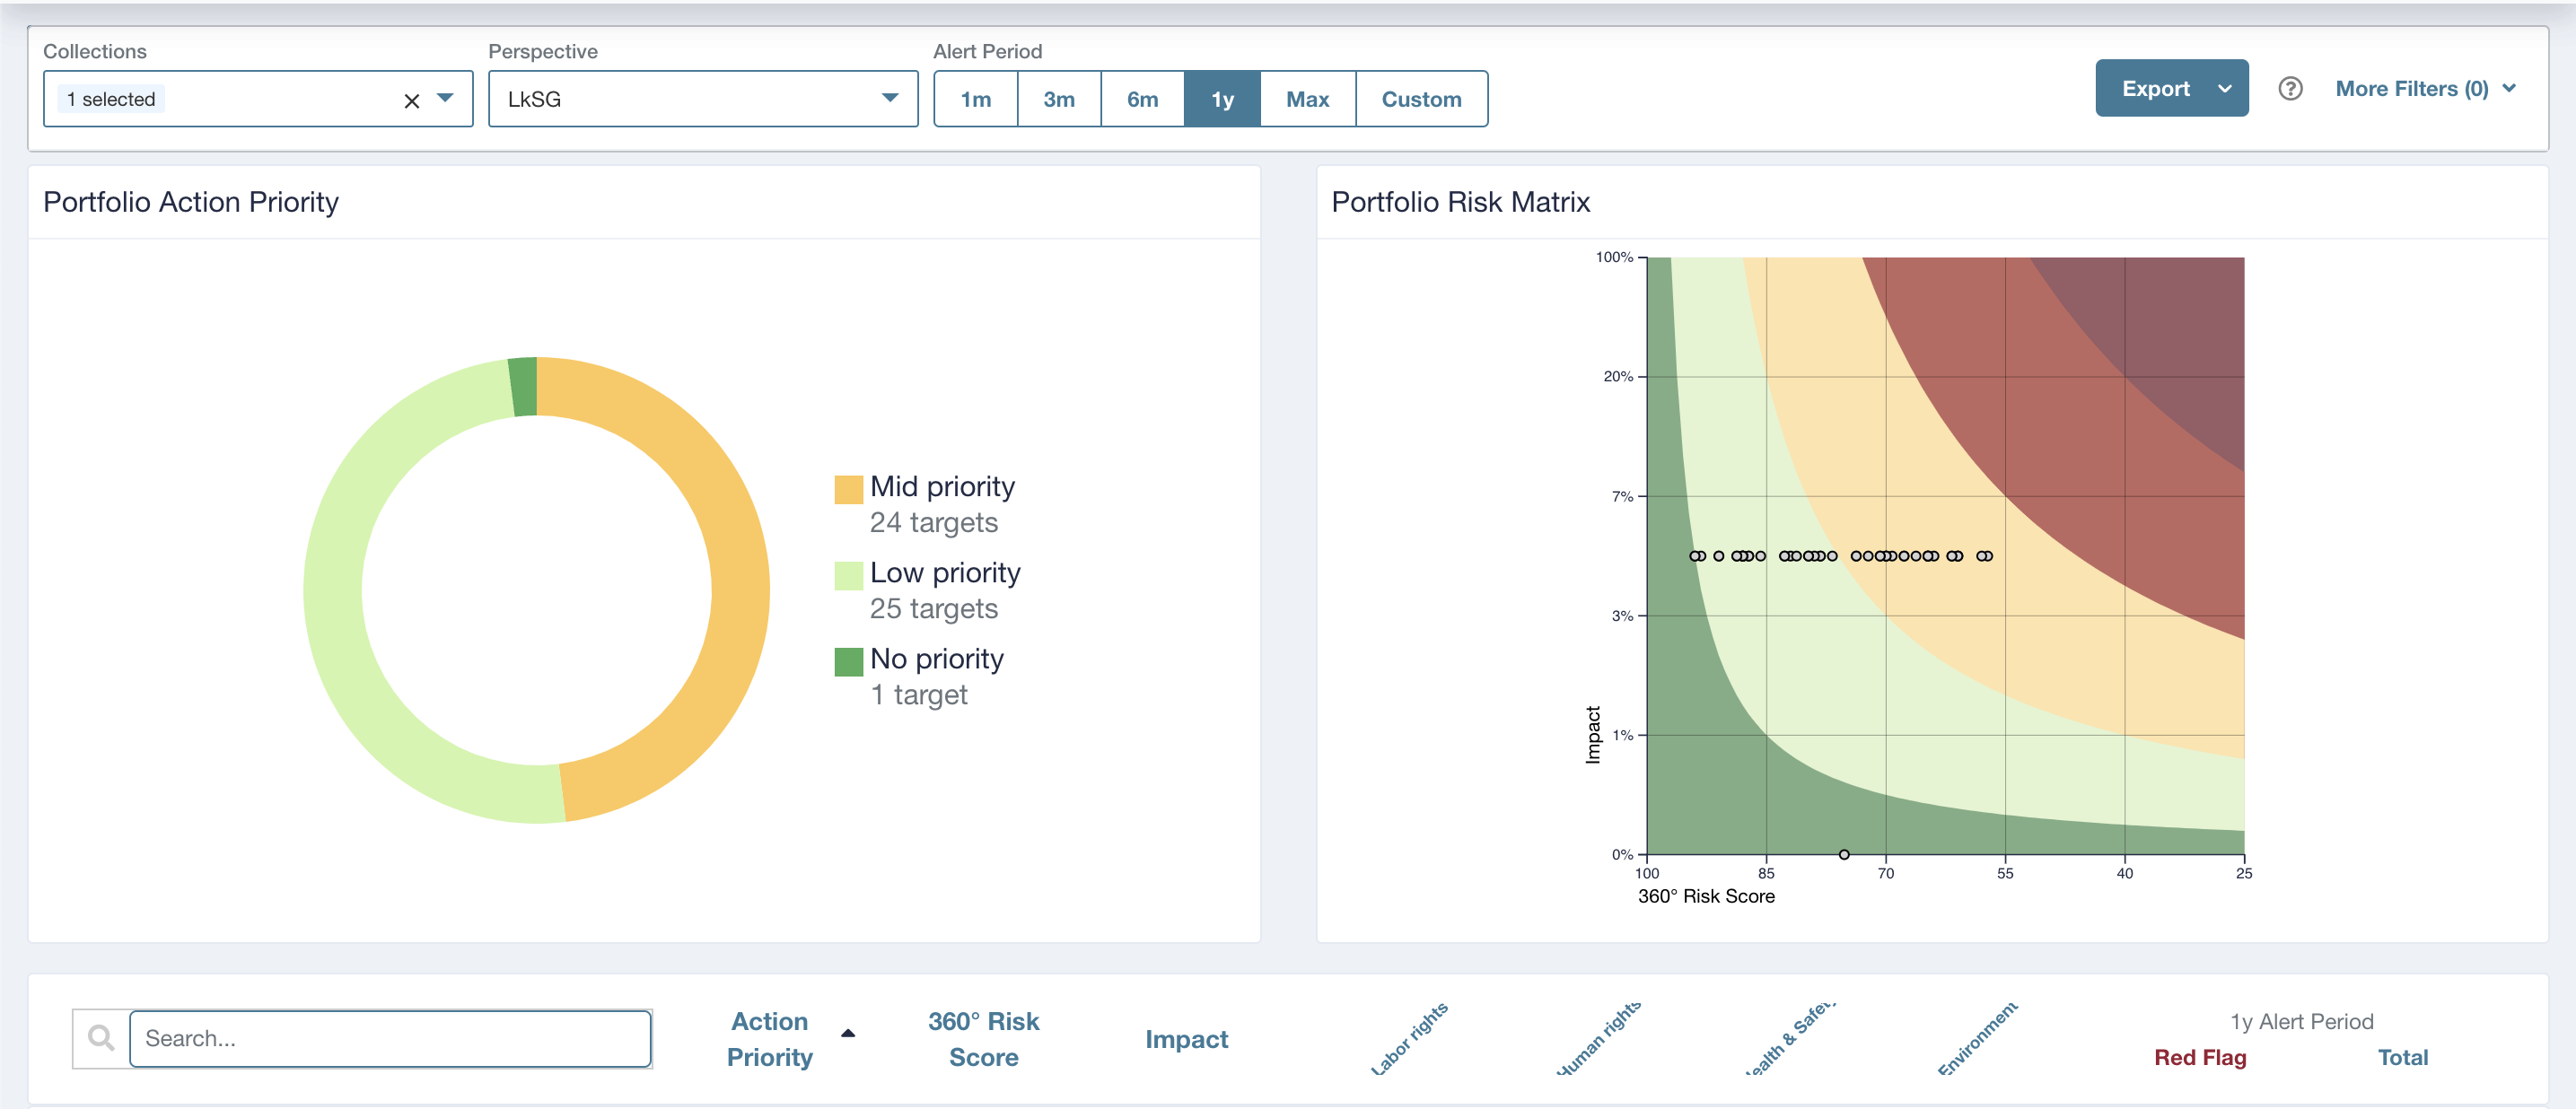
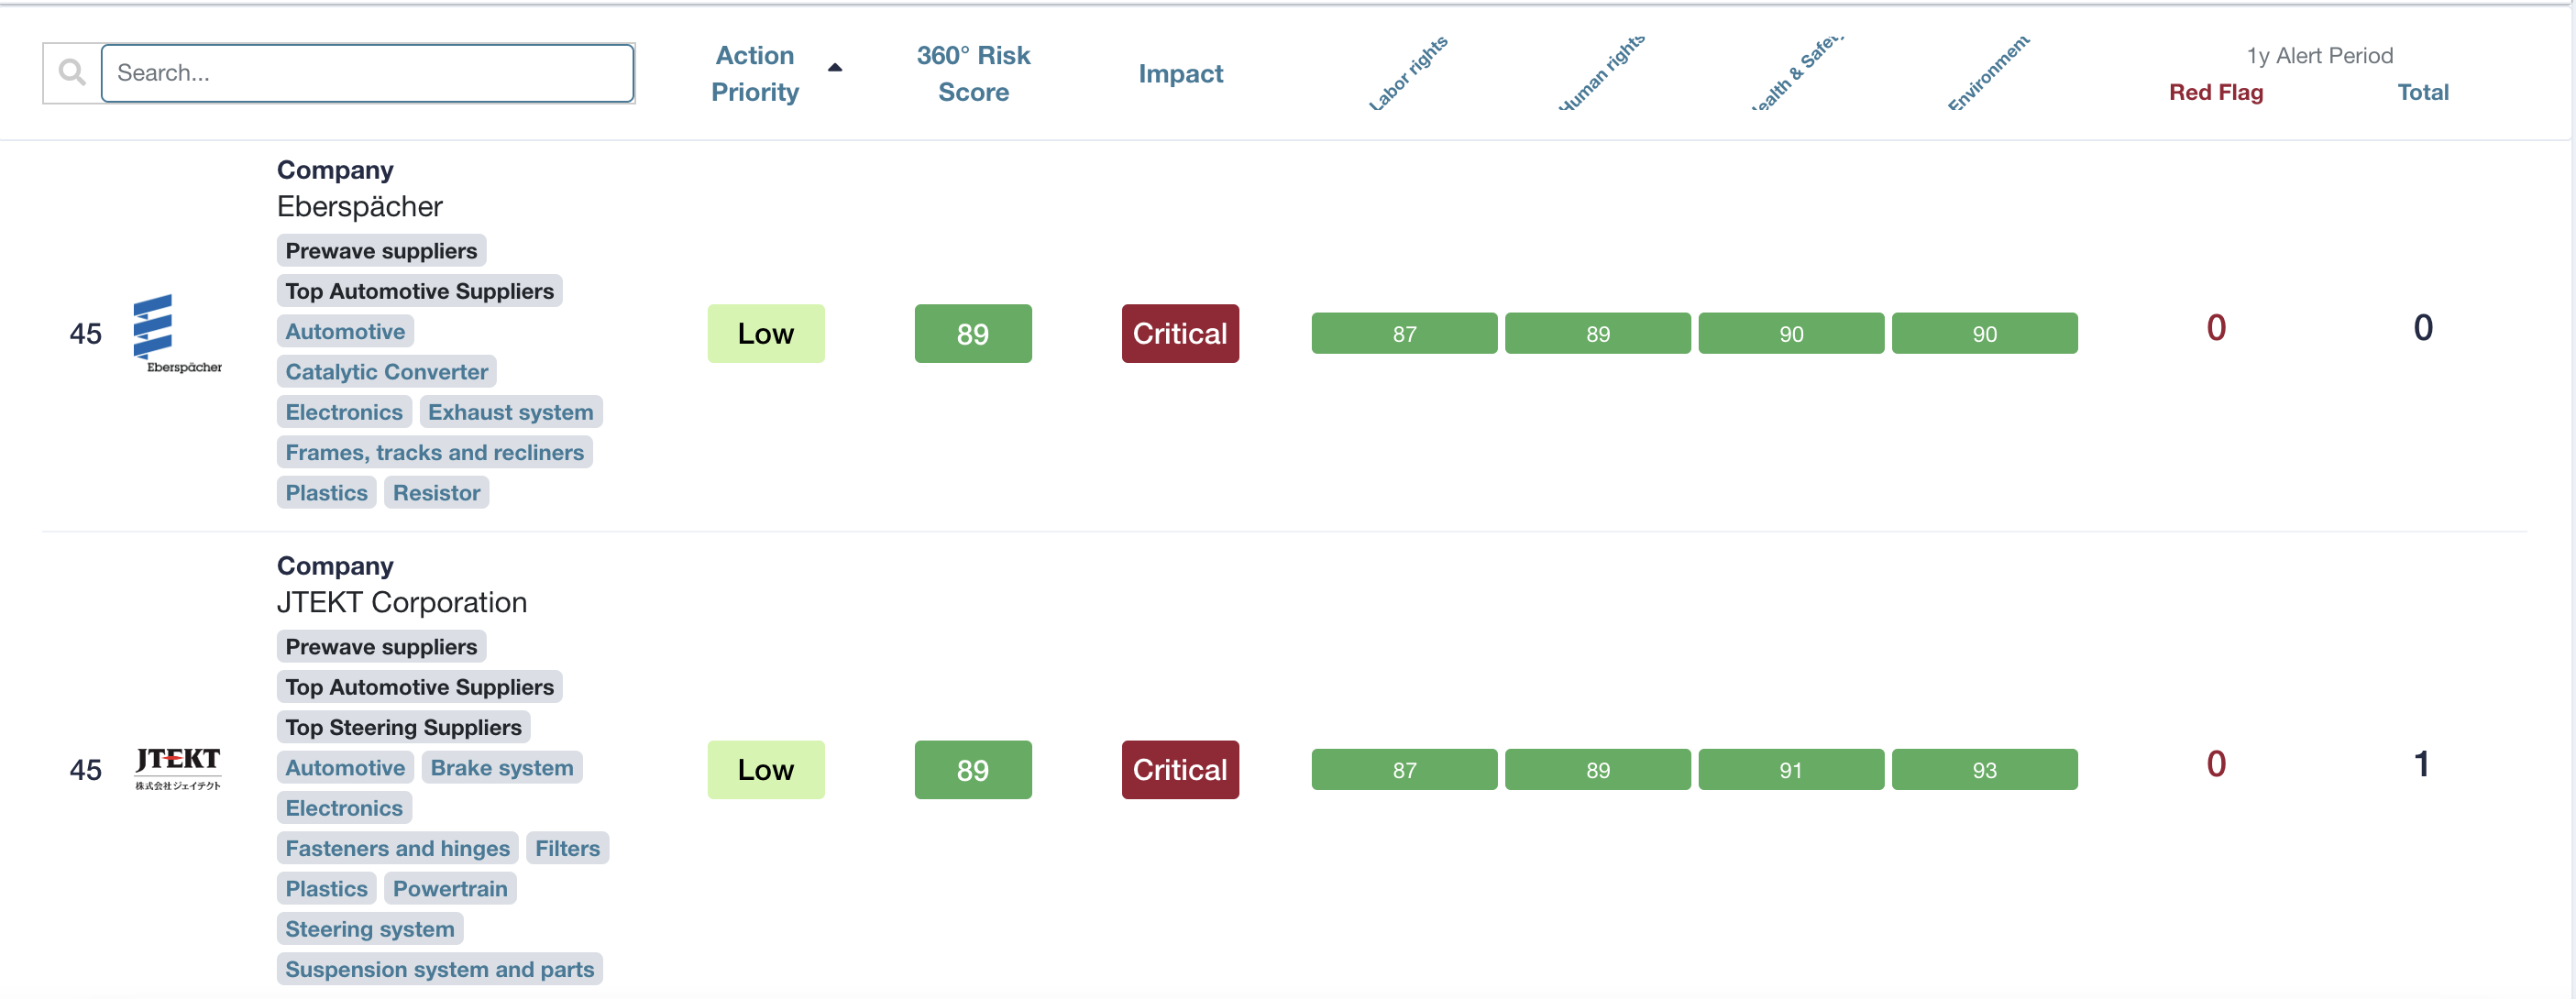
In the risk analysis area you can find information about Alert priority, 360° Score, Impact (Impact represents the influence a customer has on its supplier - the spend volume is compared to the supplier revenue) (dependent on perspective selection). Further the suppliers are displayed in two diagrams, to visualize the selected data. The ring diagram on the left shows an overview about the action priority of the suppliers displayed in the list. The risk matrix on the right shows the suppliers depending on impact and 360° risk score. The supplier list on the bottom shows how the suppliers perform within the different risk categories (labor, political, financial - also dependent on perspective selection). The score shown there is calculated based on the alert history of the supplier within the risk category.
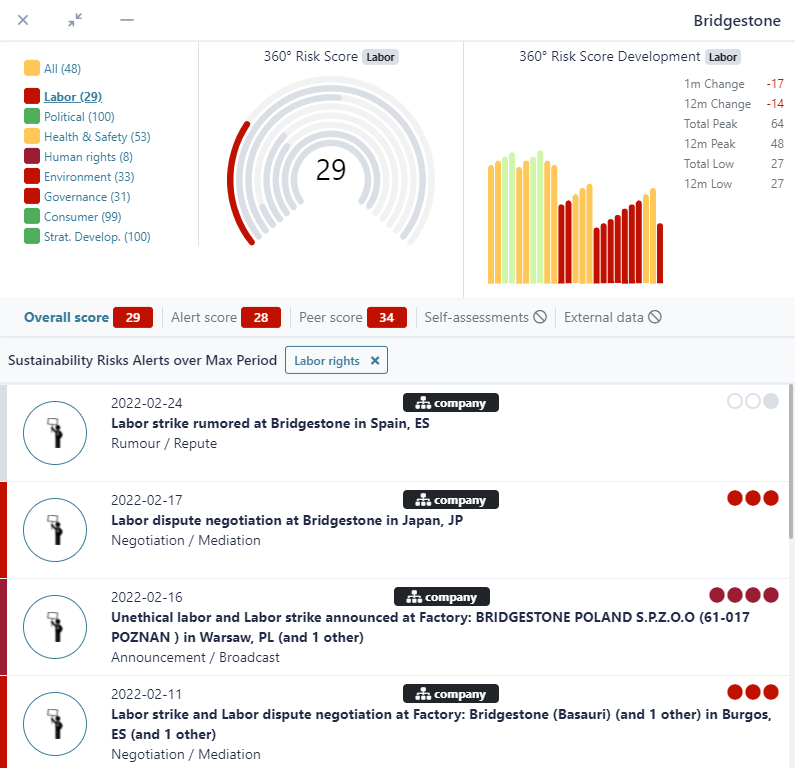
With a click on one of the risk category scores the alert history will be shown (see below). The diagram on top right shows in addition how the score developed over the time and provides a possibility to see which alert influenced the 360° Risk Score at which time by clicking on a single bar of the bar chart. After the score was influenced by an alert the score will increase again over time. You can jump to other risk categories on the left side by clicking on the names.