
Detailed step-by-step instructions on the Prewave platform
Content
In the specific risk analysis, the main suppliers are analysed in more detail. They undergo a historical screening over a period of at least 2 years to check whether there are any specific risks. This review using Prewave's artificial intelligence is called "Red Flag Screening".
The Screening process
Once the high risk suppliers have been selected, they should undergo the red flag screening process as part of the specific risk analysis.
Option A (current version):
To trigger this process, all suppliers previously added to the risk analysis (see Categorisation of high risk suppliers) must be exported to an Excel file. Your Customer Success Manager (CSM) can assist you with this step before the screening process can be triggered via the platform (see option B). The "Export" button (Fig. A2) must currently be clicked in the "Reporting" tab (Fig. A1).
Fig. A1: The "Reporting" tab can be used to drag an Excel file with all suppliers added to the analysis.

Fig. A2: By clicking on "Export", the file is generated and either downloaded directly or made available in the Reporting Centre if the calculation time is longer (see below).
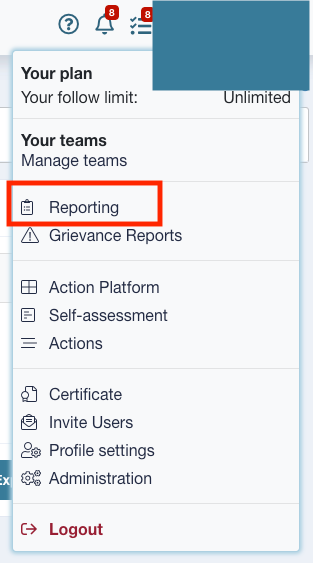
An .xls file with all previously selected suppliers is either downloaded directly or made available for download in the Reporting Centre. The Reporting Centre can be found by clicking on the user
name in the top right-hand corner of the platform (Fig. A3). Please send this list to your Customer Success Manager. They will create a ticket for the red flag screening of your suppliers and get back to you with a possible time frame in which the task should be completed.
Fig. A3: The reporting centre in the user menu.
Option B (new version):
By selecting all recommended suppliers in the "Suppliers" tab and clicking the "Request Screening" button (Fig. 1), the screening is triggered at Prewave. In addition to the abstract risk factors of country and industry score, the suppliers also receive an alert score based on media data from media reports in over 50 languages, collected over a period of at least 2 years. The screening also collects the supplier's revenue data, which is necessary for calculating the impact on the supplier.

Fig. 1: A historical media screening can be requested for the selected suppliers.
"Risk Matrix" tab
As soon as the screening has been successfully completed, the suppliers to be analysed are visualised in two different views in the next tab "Risk Matrix" (Fig. 2).
Abb. 2: Action Priority and Risk Matrix
The planning of the subsequent preventive and remedial measures is based on an assessment of the ability to influence the supplier ("impact"). The combination of the 360 degree score and the impact is shown on the right-hand side of the "Risk Matrix" tab (see Fig. 3).
The x-axis shows the 360 degree score, i.e. the overall
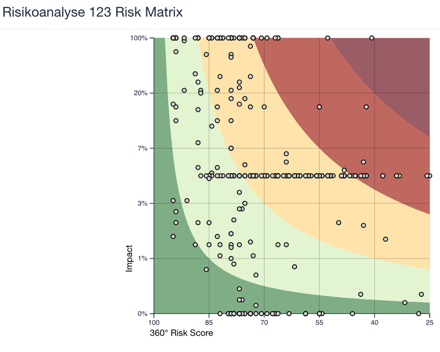
risk score from all the risk analyses. available score components. The y-axis reflects the influence on the respective supplier through the ratio of the annual turnover to the total turnover of the direct suppliers. The combination of both factors shows which suppliers are categorised as critical or risky (dark or light red) or as medium (yellow), low (light green) or not requiring any action (dark green) in terms of action priority.
In special cases, "Adjust Threshold" can be used to change the action priorities resulting from the risk matrix by adjusting the threshold values for the critical to low categories.
To do this, the button must be pressed, as shown in Fig. 3.1.
⚠️ Caution: If the threshold values are changed, they may no longer be LkSG-compliant!

Fig. 3.1: Optional change of the threshold values for the categorisation of the five action priority categories
If the threshold values are nevertheless to be changed (Fig. 3.2), the values for categorisation of the 360° score on the x-axis (1) and for the impact on the y-axis can be changed using the respective slider. This means that the critical values for defining the need for action can be categorised as more or less stringent.
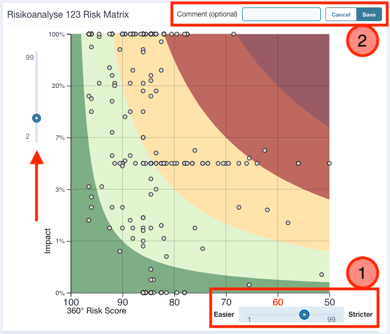
If changes are made here, it is advisable to fill in the comment field (2) and indicate why other threshold values have been used. This comment does not appear in the BAFA report bu
t is only used for your own documentation and traceability.
Fig. 3.2: The threshold values of the x- and y-axis can be shifted using two sliders and a comment can be added to explain this action.
Example 1: You adjust the threshold for the impact by increasing the original value of 20 % to 40 %:
The initial value of 20% indicates that an impact of 20% based on annual spend to annual sales defines a critical impact. After the adjustment, only suppliers for whom your annual spend represents 40% of the supplier's revenue would define a critical influence. You have shifted the thresholds in a less strict direction.
Example 2: You adjust the threshold for the 360° score on the x-axis by increasing the original value from 40 to 60:
The initial value of 40 indicates that suppliers with a risk of 40 or below represent a critically high risk. After the adjustment, suppliers with a 360° score of 60 or below would already indicate a critical risk. You have therefore shifted the threshold values in a stricter direction.
Prewave recommends leaving the threshold values for LkSG reporting unchanged and including all suppliers with a critical or high priority (see Fig. 4) in the action plan. For those suppliers specific risks have been identified and the impact is high enough that the application of a measure can also be expected to have a realistic effect.

Fig. 4: The action priority chart visualises how many suppliers have been identified as requiring action and how many suppliers can currently be considered non-critical.
If you scroll below the two visualisations, you will also see a list of the suppliers in the analysis (Fig. 5). By default, this is sorted by Action Priority in descending order. The LkSG-relevant areas of labour rights, human rights, health & safety and the environment are listed with their respective scores, as are the action priority, the 360-degree score and the ability to influence ("Impact").
Fig. 5: Listing of suppliers by action priority with descending criticality.
If you click on the 360° Risk Score (Fig. 6), it is possible to view the supplier profile again in detail.
Abb. 6: Mit Klick auf den Risiko-Score gelangt man zu einer Übersicht über den Lieferanten.
All score components and the development of the score over a period of 24 months (360° Risk Score Development) are listed here (Fig. 7). All LkSG-relevant alerts are also listed.
Fig. 7: The supplier profile is displayed as an overlay over the current view. No new browser window is opened and the underlying information is retained. The supplier profile can simply be closed again using the "x" in the top left-hand corner
It is not always possible to determine the impact with 100% accuracy. The reasons for this are, for example, that for some companies only imprecise, out-of-date or no turnover figures are published. Prewave cannot always determine accurate values here either. It is therefore possible to overwrite the calculated impact. The impact that a company has on a supplier can be forced to a different value by right-clicking on the supplier to open it in a new browser tab. In the "Data" tab (Fig. 8, 1), the "Edit" button (2) must now be clicked.
📝 Good to know: To prevent mishaps, only users with the Role Connection Manager can amend the impact.

Abb. 8: Im “Data” Tab eines Lieferanten können kundenspezifische Änderungen vorgenommen werden.
The impact can then be set to a different value (see Fig. 9). It is advisable to document in the comment field that the impact has been changed manually and for what reason.

Fig. 9: The degree of influence ("Impact") can be overwritten manually if required.
Furthermore, in the supplier profile, you can also report to Prewave that incorrect/inaccurate/not up-to-date information may be present. Here too, it is advisable to right-click to open the profile in a new browser window/tab: first click on the "more" button (Fig. 10) and then select "Report wrong info" (Fig. 11).

Fig. 10: The "More" button can be used to report, among other things, inaccurate information about a supplier.

You can report whether an incorrect industry and/or incorrect sales data may have been determined (Fig. 12). It is helpful to leave a comment explaining this. Click on "Send" to send the report to Prewave. The information will be checked internally and you will be notified when the report has been processed.
Fig. 11: Potentially incorrect information about a supplier can be reported.

Fig. 12: You can notify Prewave about the following inaccuracies: - missing or wrong industry allocations, - wrong annual turnover. Prewave will then be able to check this information internally and adjust it if deemed warranted.
Let's return to the degree of influence: If the impact needs to be changed for several suppliers at the same time, this can easily be done in the "Suppliers" tab (see Fig. 13). If there is no influencing capacity, no measures need to be planned. Conversely, however, measures must be planned if there is influence and risks exist. It is therefore advisable to document why this criterion is changed manually.

Fig. 13: To make settings for several suppliers simultaneously in the risk analysis, you must navigate back to the "Suppliers" tab.
In the "Suppliers" tab, select all suppliers by ticking them (Fig. 14, 1) and then click on "Set Degree of Influence" (similar to "Request Screening" from the screening process at the beginning of this chapter).
Fig. 14: All relevant suppliers must be ticked before "Set Degree of Influence" is set.
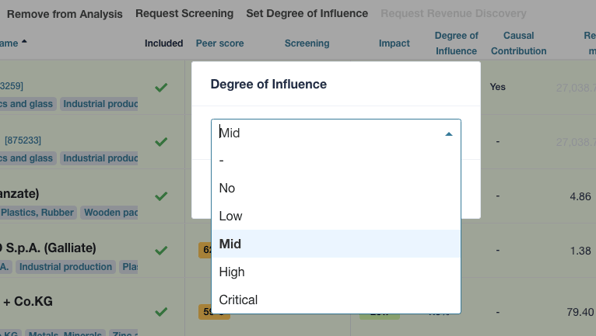
Now the level can either be increased if you have a (fairly) high level of influence with a supplier (see Fig. 15). Conversely, this can also be lowered. Confirm by clicking on "Apply to selected targets". There is currently no comment field in this process to document the action. However, this feature is under development and should be available soon.
Fig. 15: The influencing capacity can be manually overwritten high or low for several suppliers at the same time as required.
The process of concrete risk analysis in the course of the annual (=regular) risk analysis by determining the risks, their weighting and prioritisation is now complete. In the next step, preventive measures can be defined for prioritised risks and remedial measures can be defined if there are indications of possible breaches (see section 2.3.1 onwards).