
In this article the contents and functionalities of the Map in Prewave are explained
The Map – also called Disruption Map – is a visual display of alerts and suppliers (POIs: Point of interest) on the world map. General Use case is the disruption perspective to highlight which areas are the most affected by recent events.

The map can be filtered through various options.
• Specific collections
• Per Perspective
• Disruption Status: Disruption Alerts will have an impact on the status
- No Risk (no alerts, green)
- At Risk (disruption of some sort identified, orange)
- Inactive (factory shut down, red)
• Company
• Event Type
• POI Type
• Map Layers
- Show Alerts
- Show POIs
- Show Lanes (visual representation of the supply chain)
- Show Border Crossings
- Show Peer Score (country and industry risks)
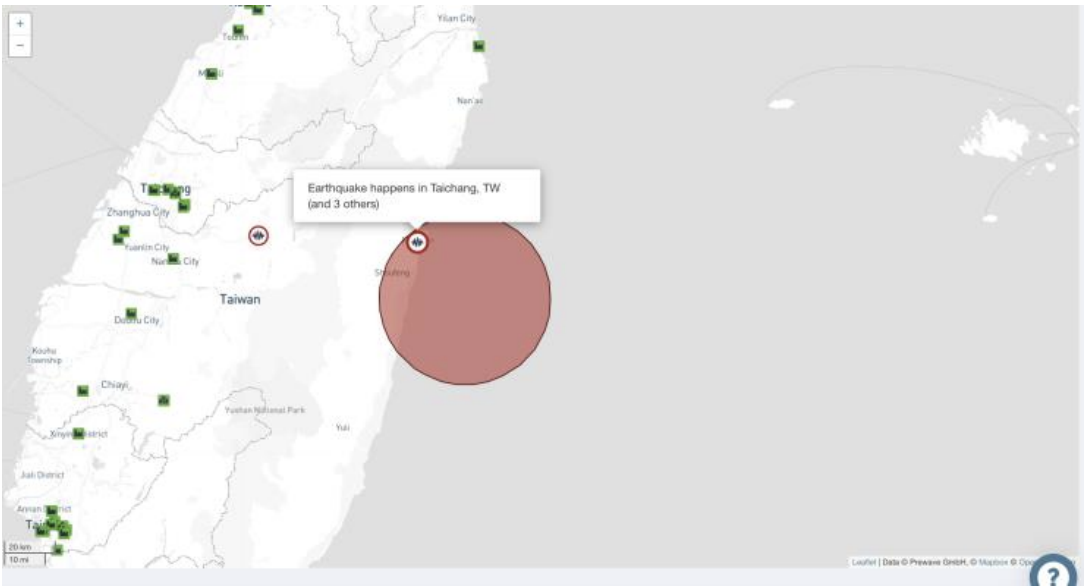
Destructive events like natural catastrophes are displayed with geographical endpoints to also showcase the affected area.
Furthermore, the user can choose to display other elements to be shown on or hidden from the map beside the POIs. The user can also view alerts, user defined lanes and the estimated border crossing times.
Finally, the url changes dynamically with the selections made by the user, and given that the recipients have the right permissions, the selections made on the map can be easily shared with other users.