
This article is about how to start a new risk analysis and how to apply measures and actions.
- Navigate to the analysis tab by clicking on the symbol in the menu on the top of the site.

- Analysis tab
The analysis tab is divided into 5 sections
- General Information
- Suppliers
- Risk Matrix
- Measures and Actions
- Reporting
Navigate to the different sections by clicking the names.

1. General Information
In the General Information area, basic information such as Name, Perspective, Date, Period, Level of Analysis and DI Model (calculates the impact) can be selected. Depending on the selection of the perspective, a different prioritisation of the risk categories is applied. In Level of Analysis a selection between Site Groups and Sites can be made. By choosing Site Group, the analysis will be done on parent organisation level, by choosing Sites the analysis will be done for the specific site locations of the parent organisation. Additional Information such as Type and Scope focuses on the due diligence reporting.
2. Suppliers
In the suppliers tab you can specify the suppliers which you want to include into the Analysis. Basically, it is possible to include each supplier, but a complete risk analysis can only be done, if information to the following points is available:
- 360° Score
- Impact
- Revenue
- Purchase Volume
The blue box in the figure below shows different tabs where suppliers are displayed regarding to the available information. The green box shows a search function to look up supplier names as well as some filter options. It's possible to filter according to collections, impact, score availability, screening status, 360 risk score or purchase volume. An additional option is, to filter the supplier list by clicking on the column names.
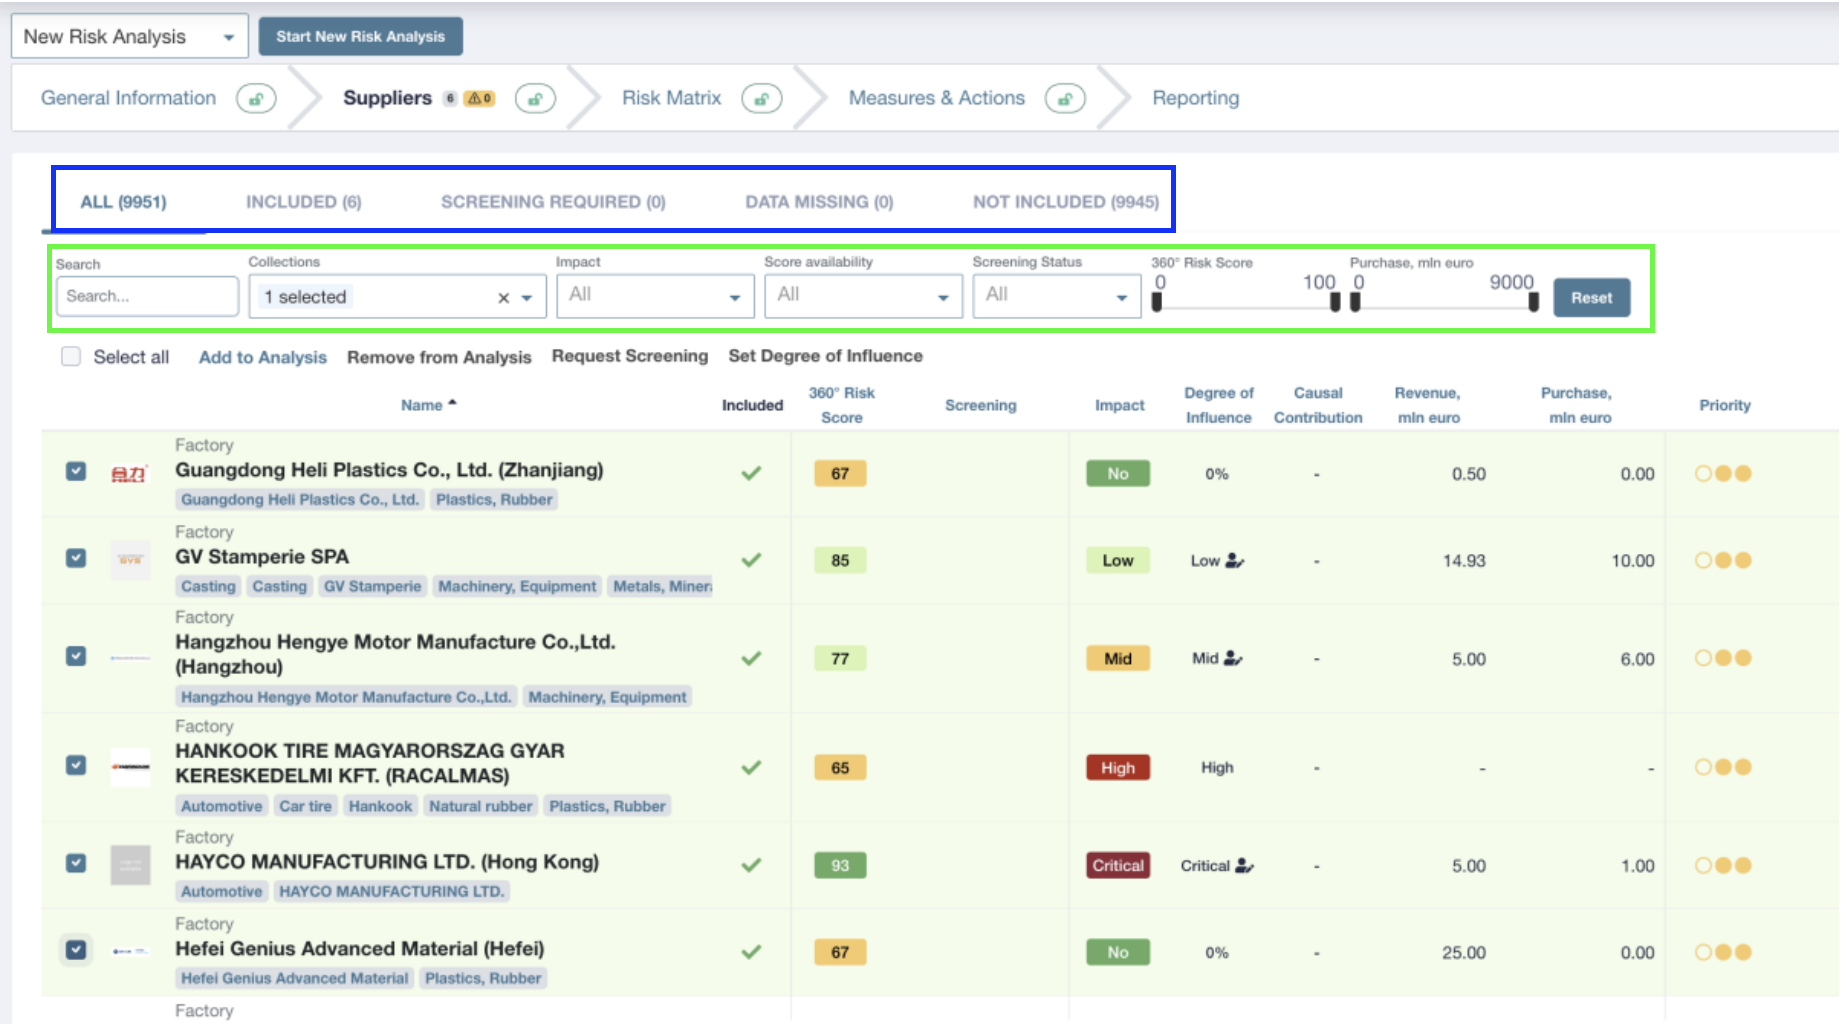
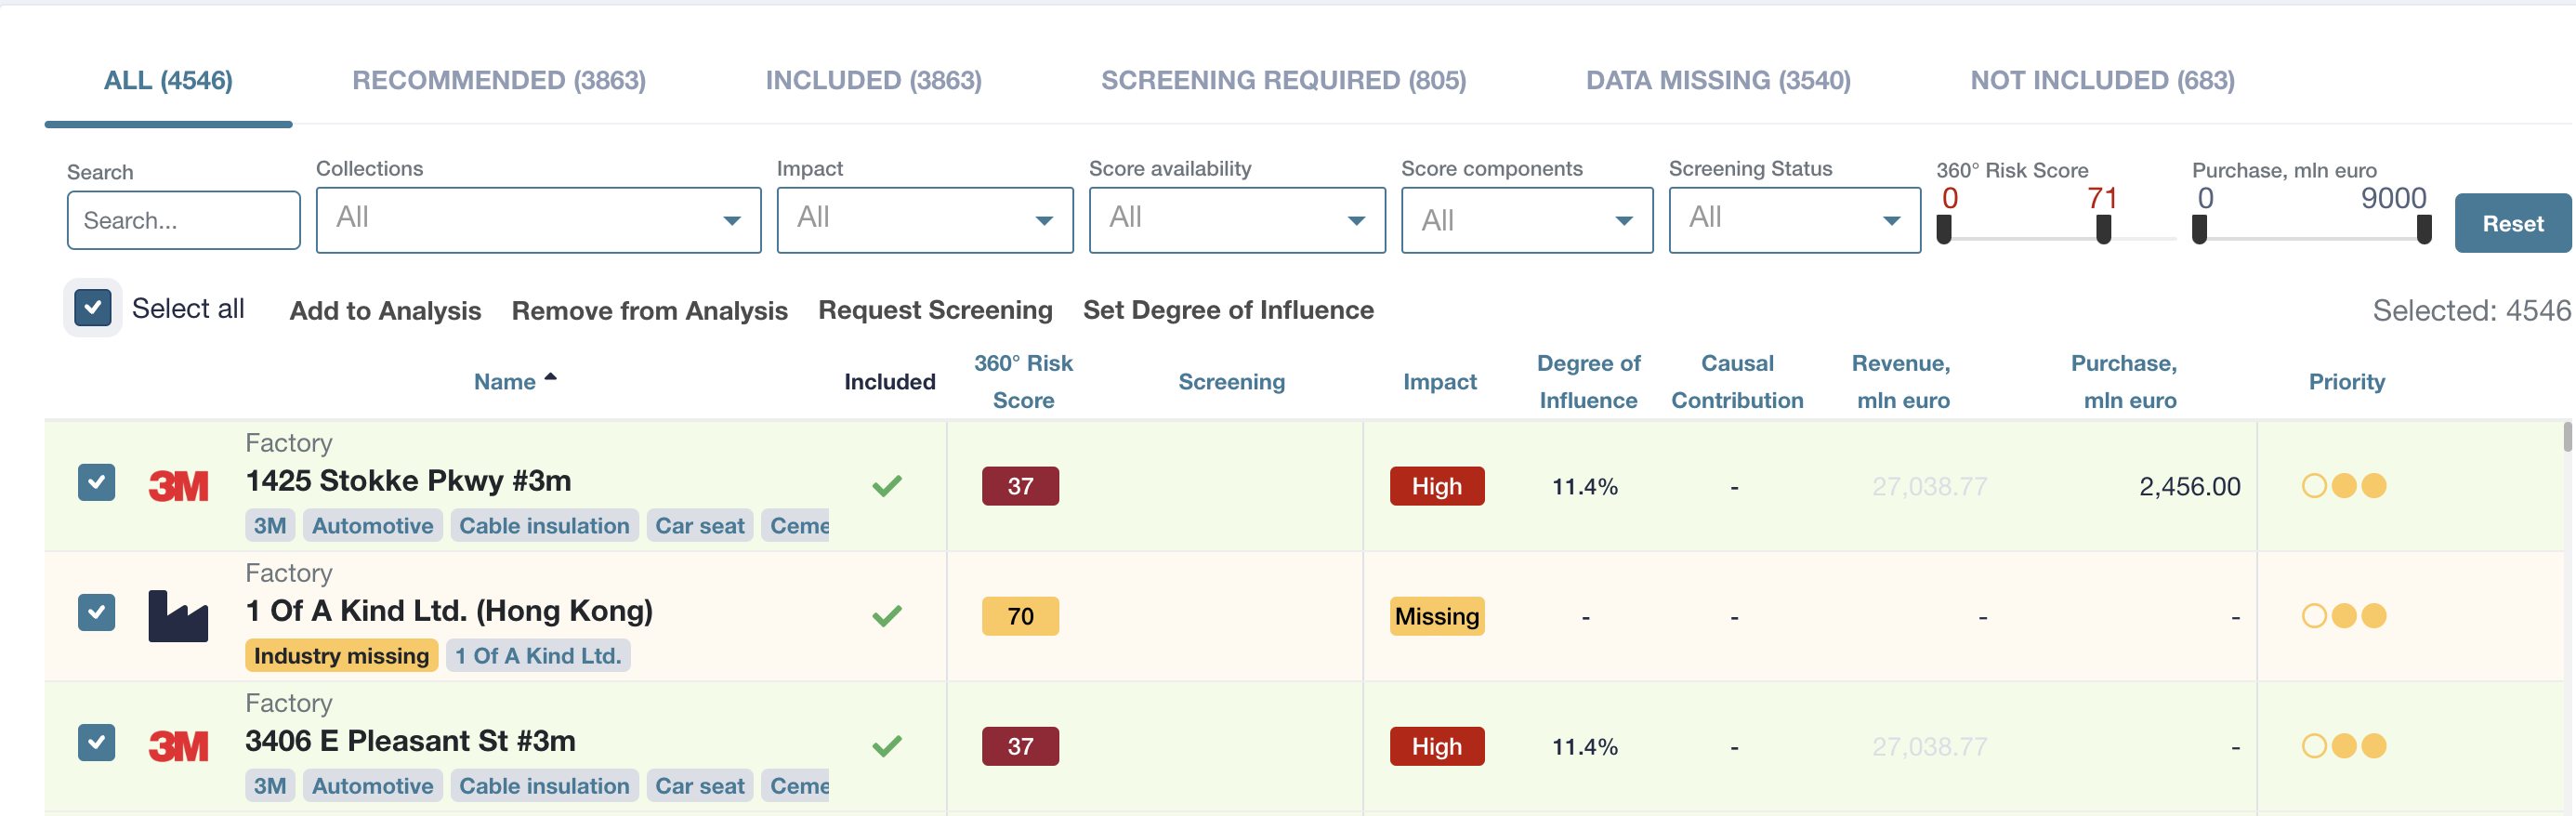
Within the area "All" specific suppliers can be added (or removed) to the risk analysis. For single selection you can use the plus sign in the "Included" column or the checkbox on the left of the supplier's name. For multiple selection there is a checkbox "Select all". After multiple selection you can add the suppliers to the list via "Add to Analysis". All suppliers for which data about 360° Score, Impact, Degree of influence, Revenue and Purchase is known are displayed with a green background.
The "Included" tab shows all suppliers which were added to the analysis.
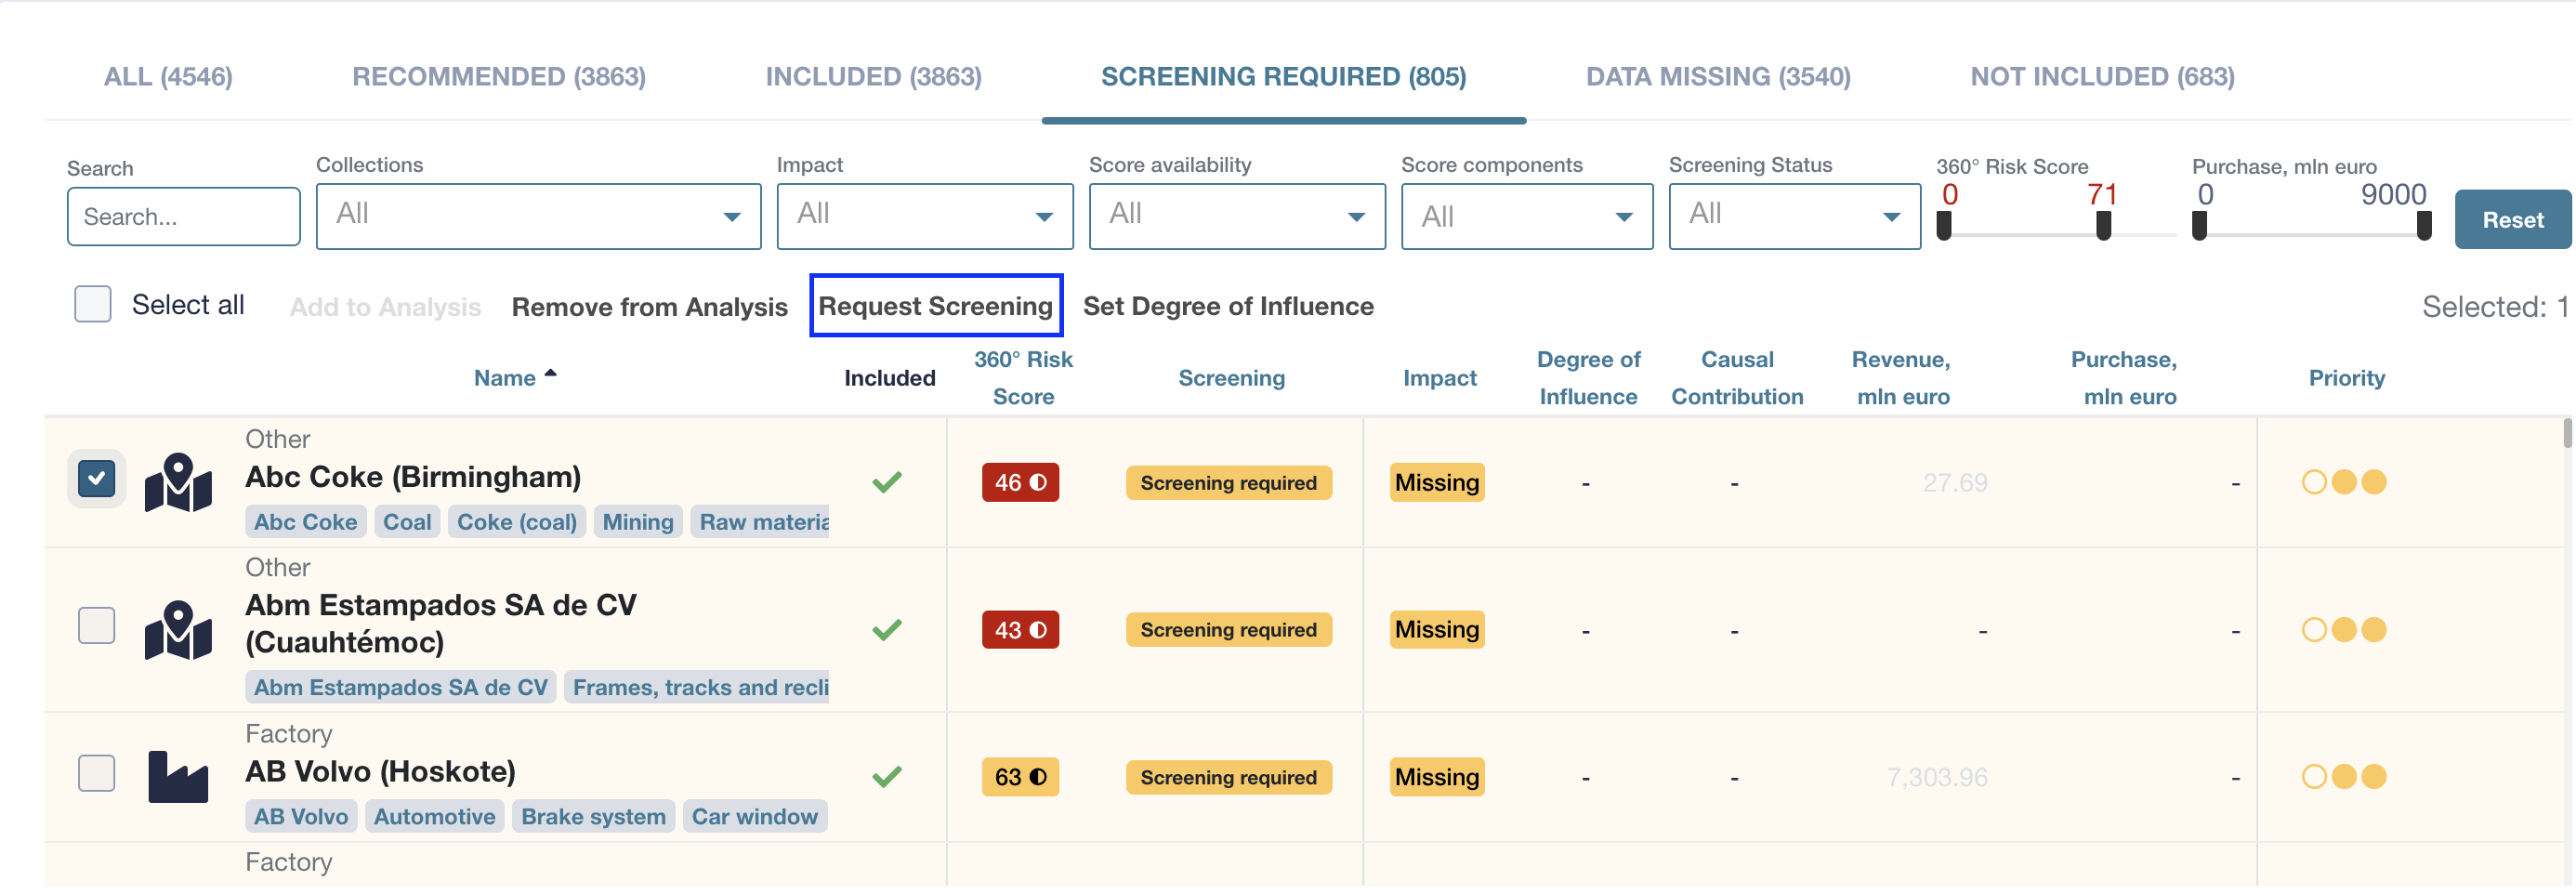
The "Screening Required" tab shows a selection of all included suppliers which lack information about the 360° score. By clicking on the suppliers name you can request a screening on the supplier target page.
The tab "Data missing" shows all the suppliers where the impact/degree of influence was not yet determined. The degree of influence is automatically calculated if both the revenue and purchase volume data for a supplier is available. The Data for the revenue of suppliers might be provided by Prewave via public data source, the purchase volume has to be provided by the customer.
Supplier Revenue information might be available, if it can be found on a publicly available source. Prewave does not guarantee completeness nor accuracy of this information.
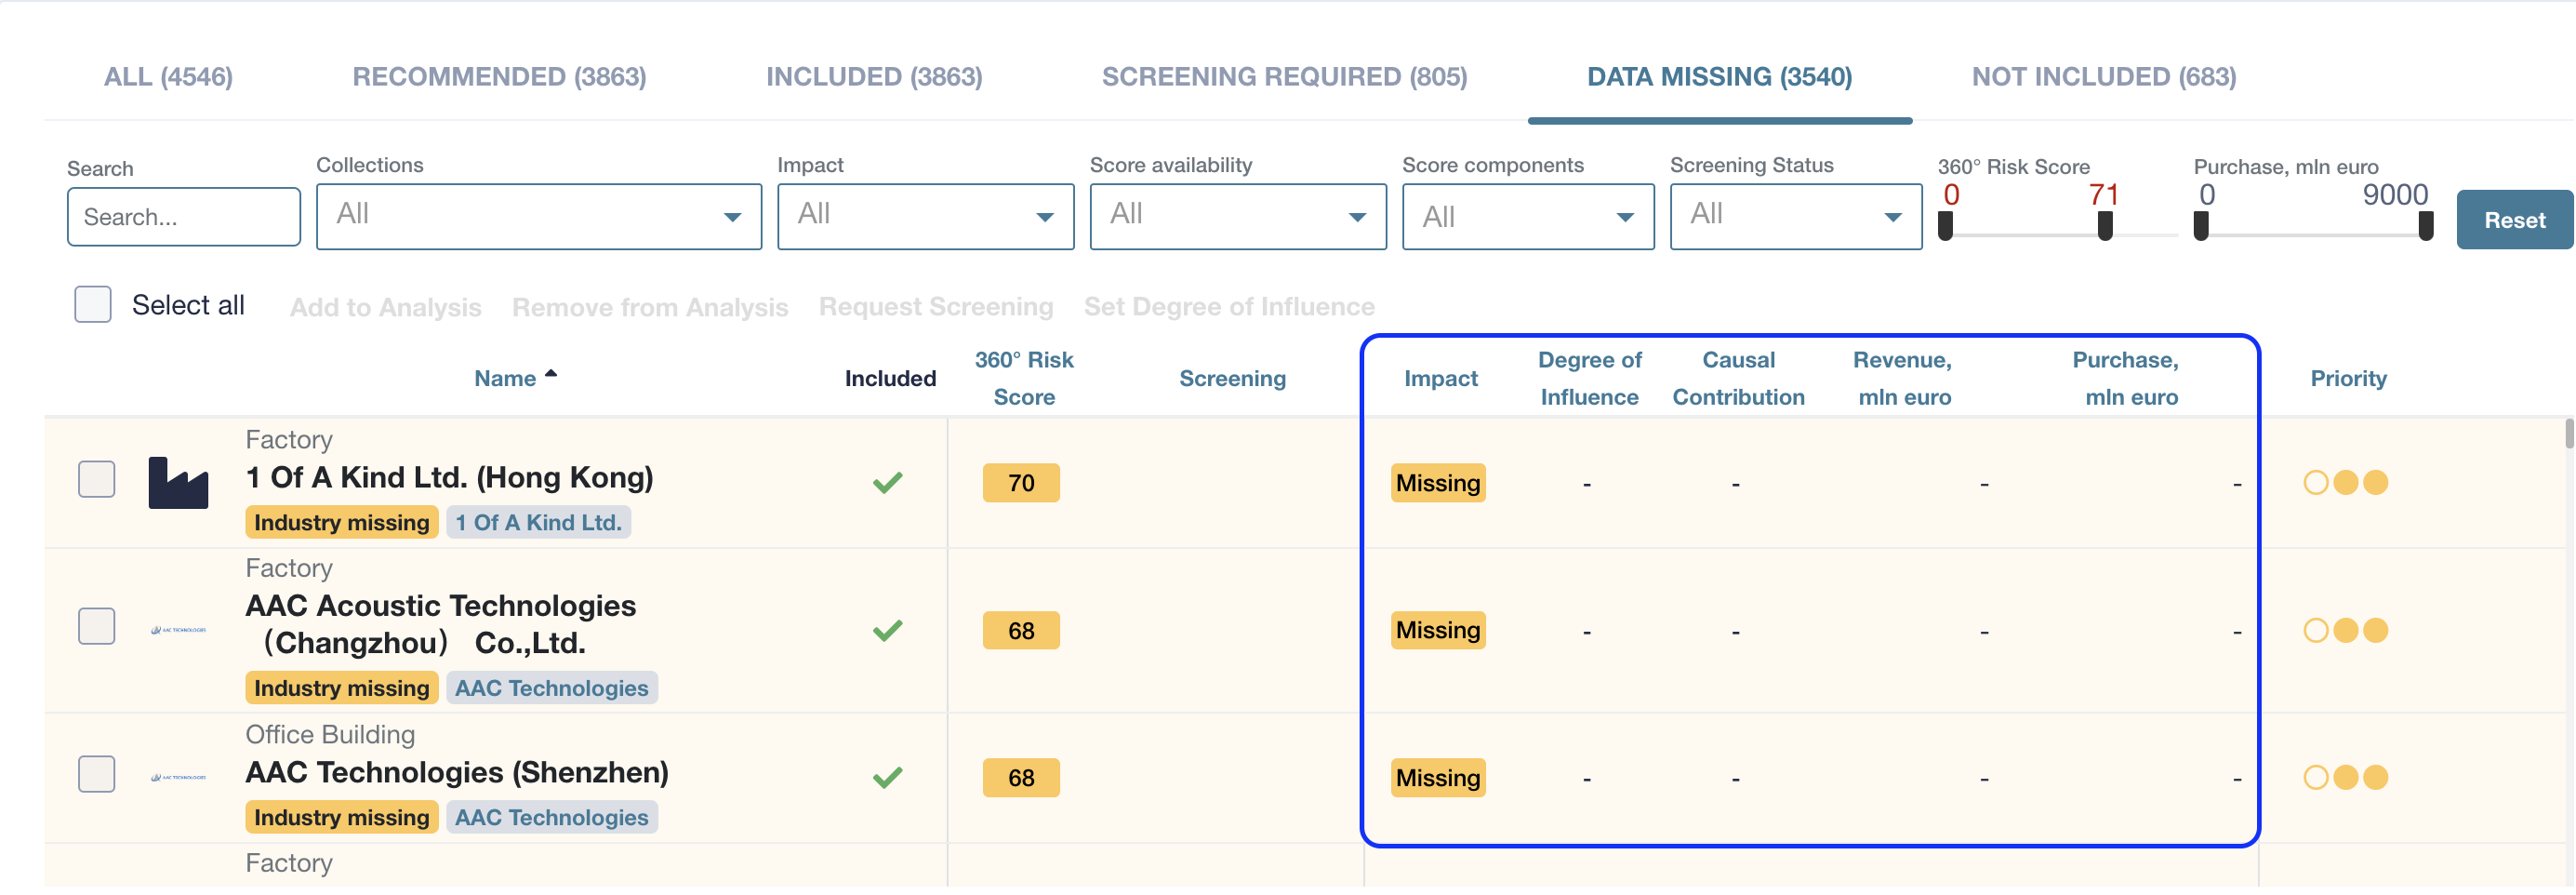
A second option to define the degree of influence is to do it manually by using the small pen which appears when hovering over the "Missing" symbol. Here you can set the degree of influence to a desired priority matching your assessment.
As soon as revenue and purchase data for a supplier is added at a later date, the degree of influence will be calculated. The result of the calculation will then overwrite the manual defined value.
The "Not Included" Tab shows a list of all suppliers which were not added to the analysis.
3. Risk Matrix
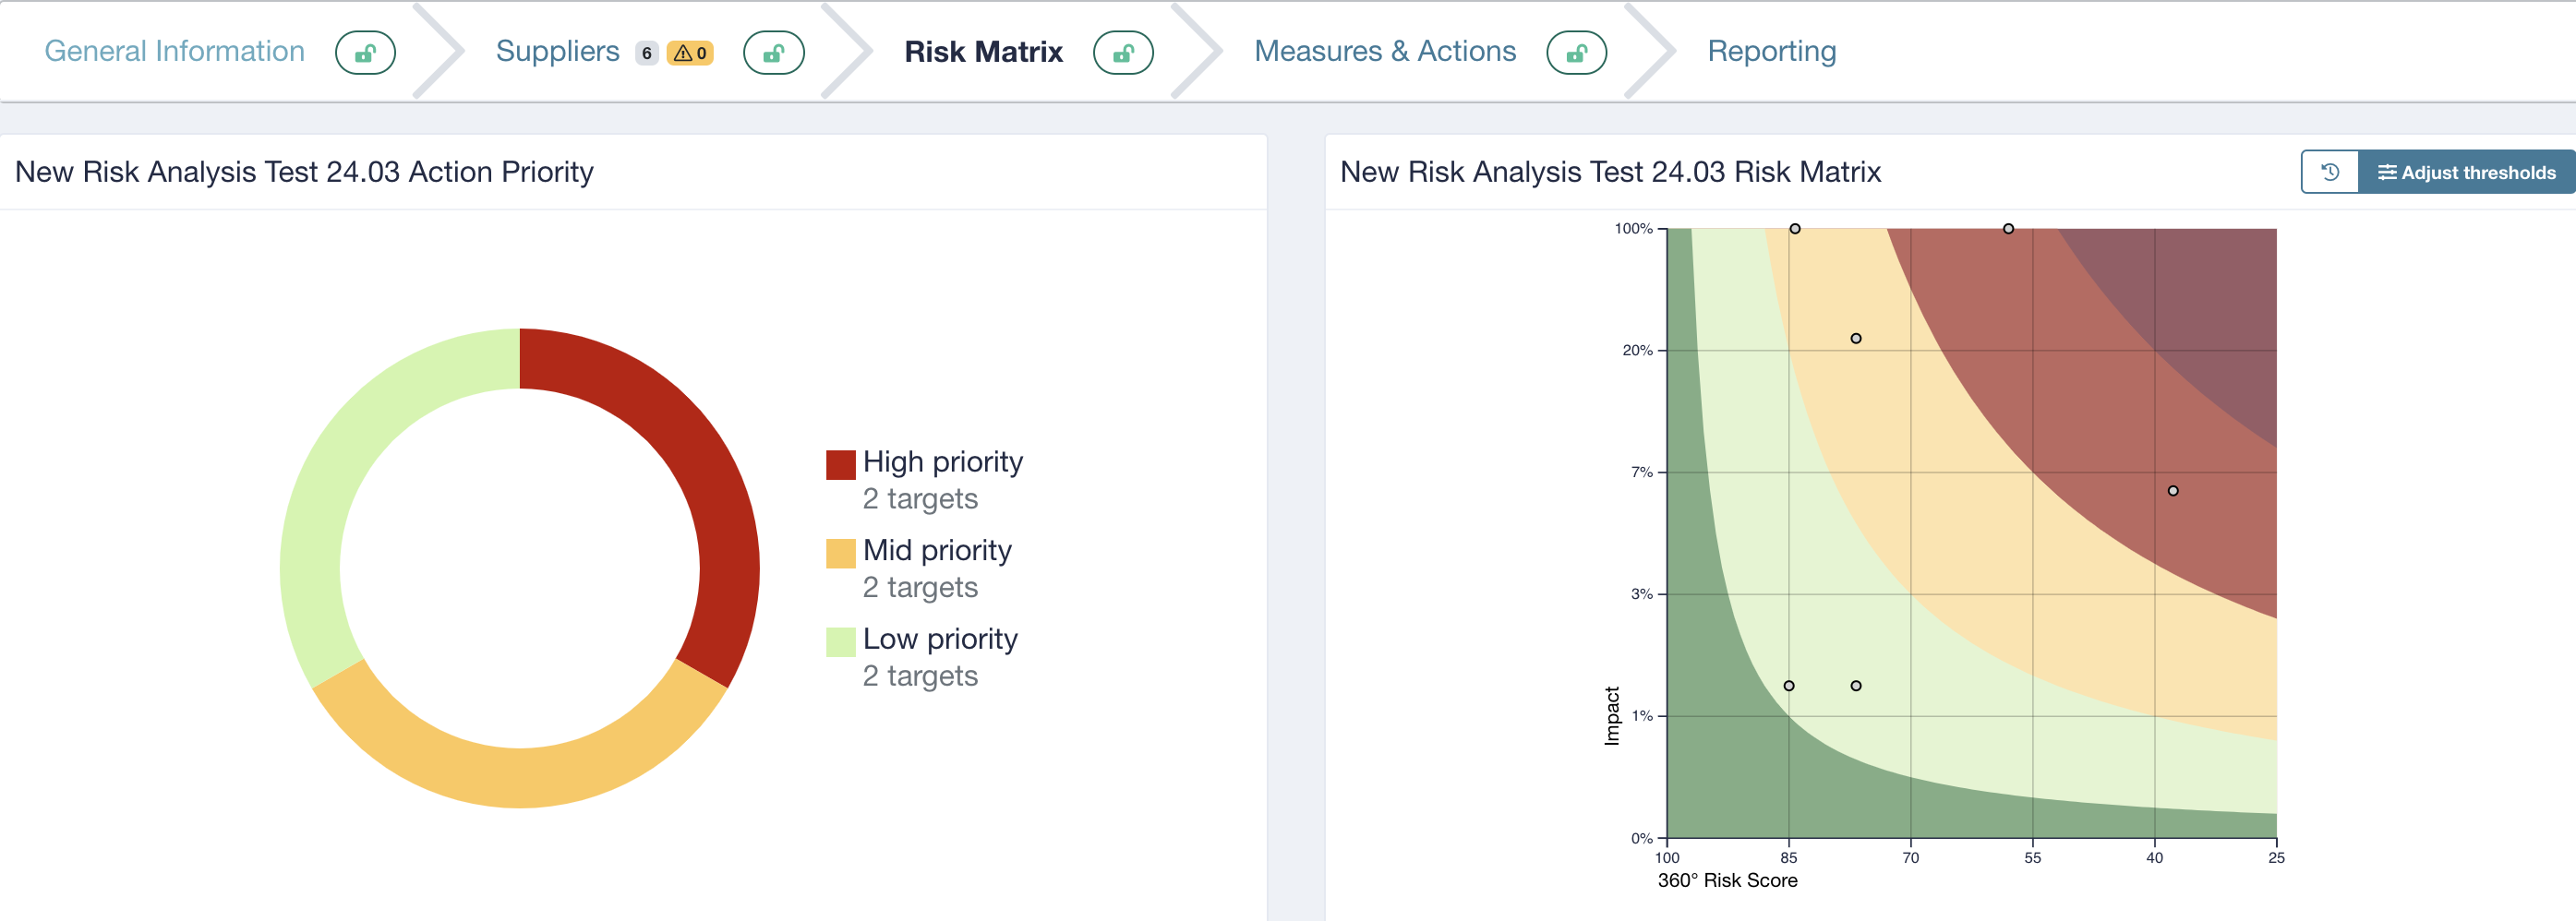
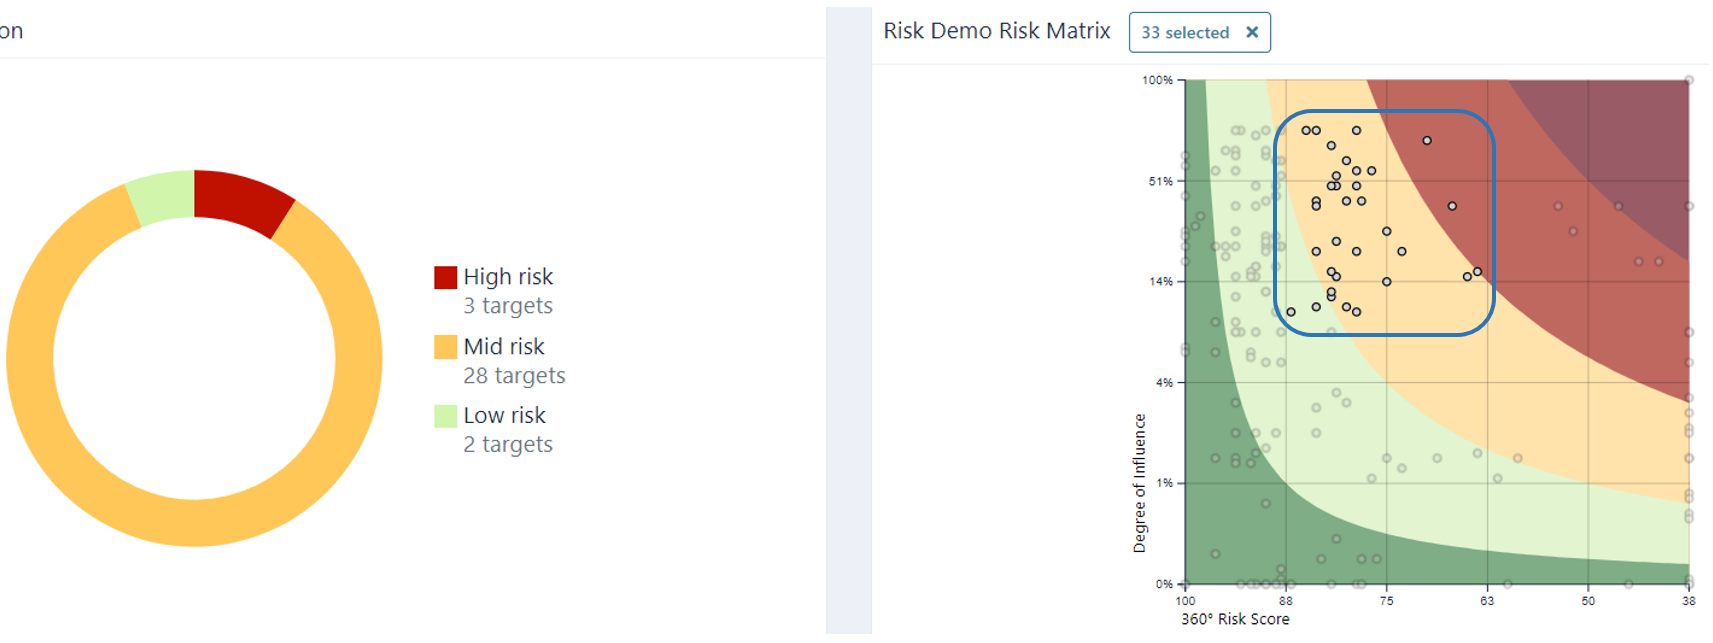
All included suppliers are now shown in the risk classification and in the risk matrix. On the left you see the Portfolio Action Priority (ring chart), which summarises targets based on the action priority. The coloured bars of the ring chart can also be used as filter. The risk matrix on the right shows the suppliers depending on impact and 360° score.
Below the diagram the suppliers are listed. There is a possibility to filter the list according to targets, collections, action priority, score availability, score components, impact and 360° Score (blue box). In addition, you can filter the list with a click on the column names.
According to the previous calculated impact and the 360° score of the suppliers, the action priority is determined. Further, the green box shows the different categories which where fundamental to determine the 360° score. Here the number of categories varies depending on the perspective chosen during the initial risk analysis setup process (in this case the categories for the LKSG perspective are shown).
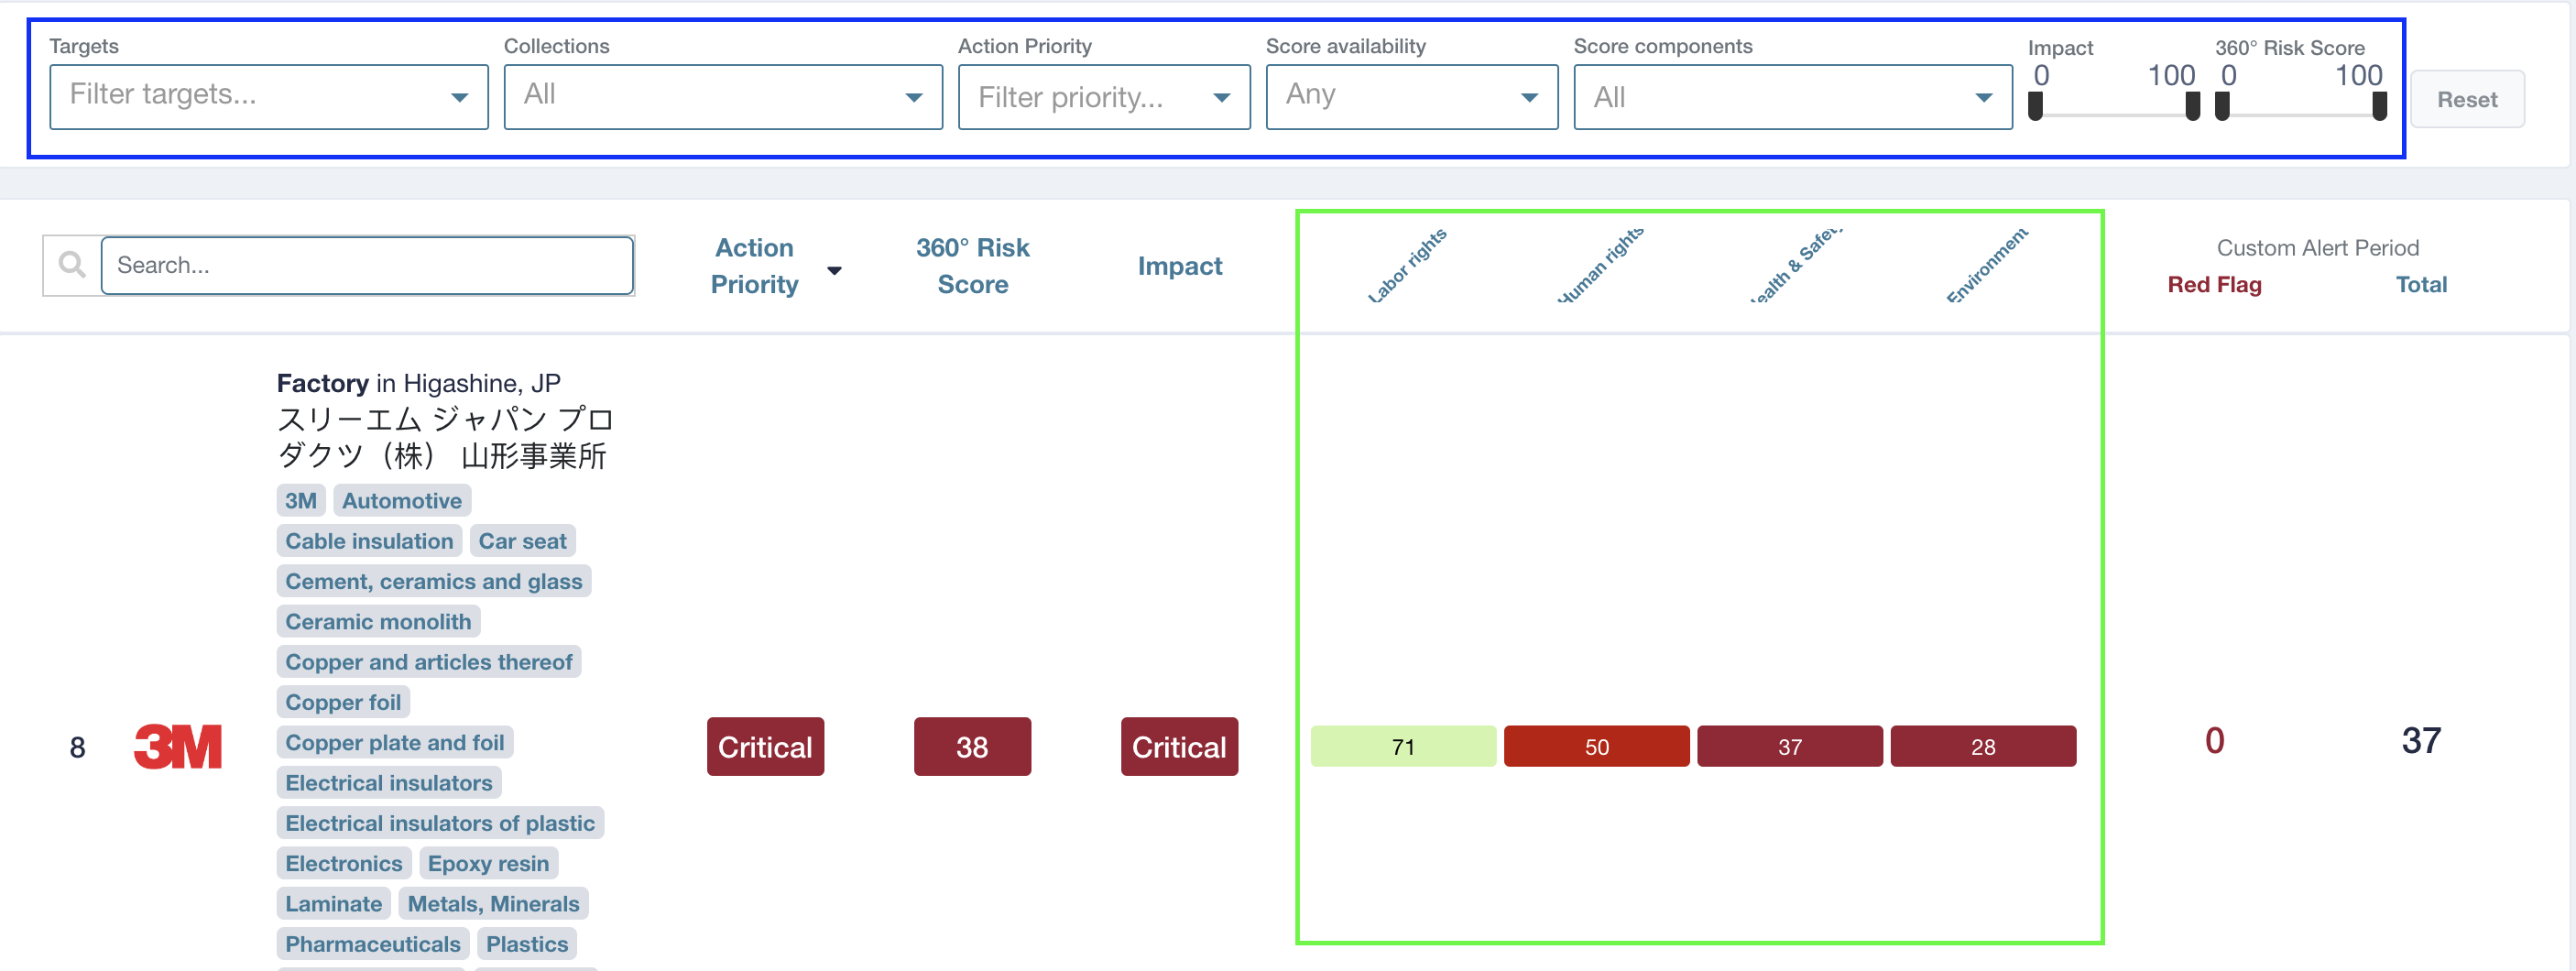
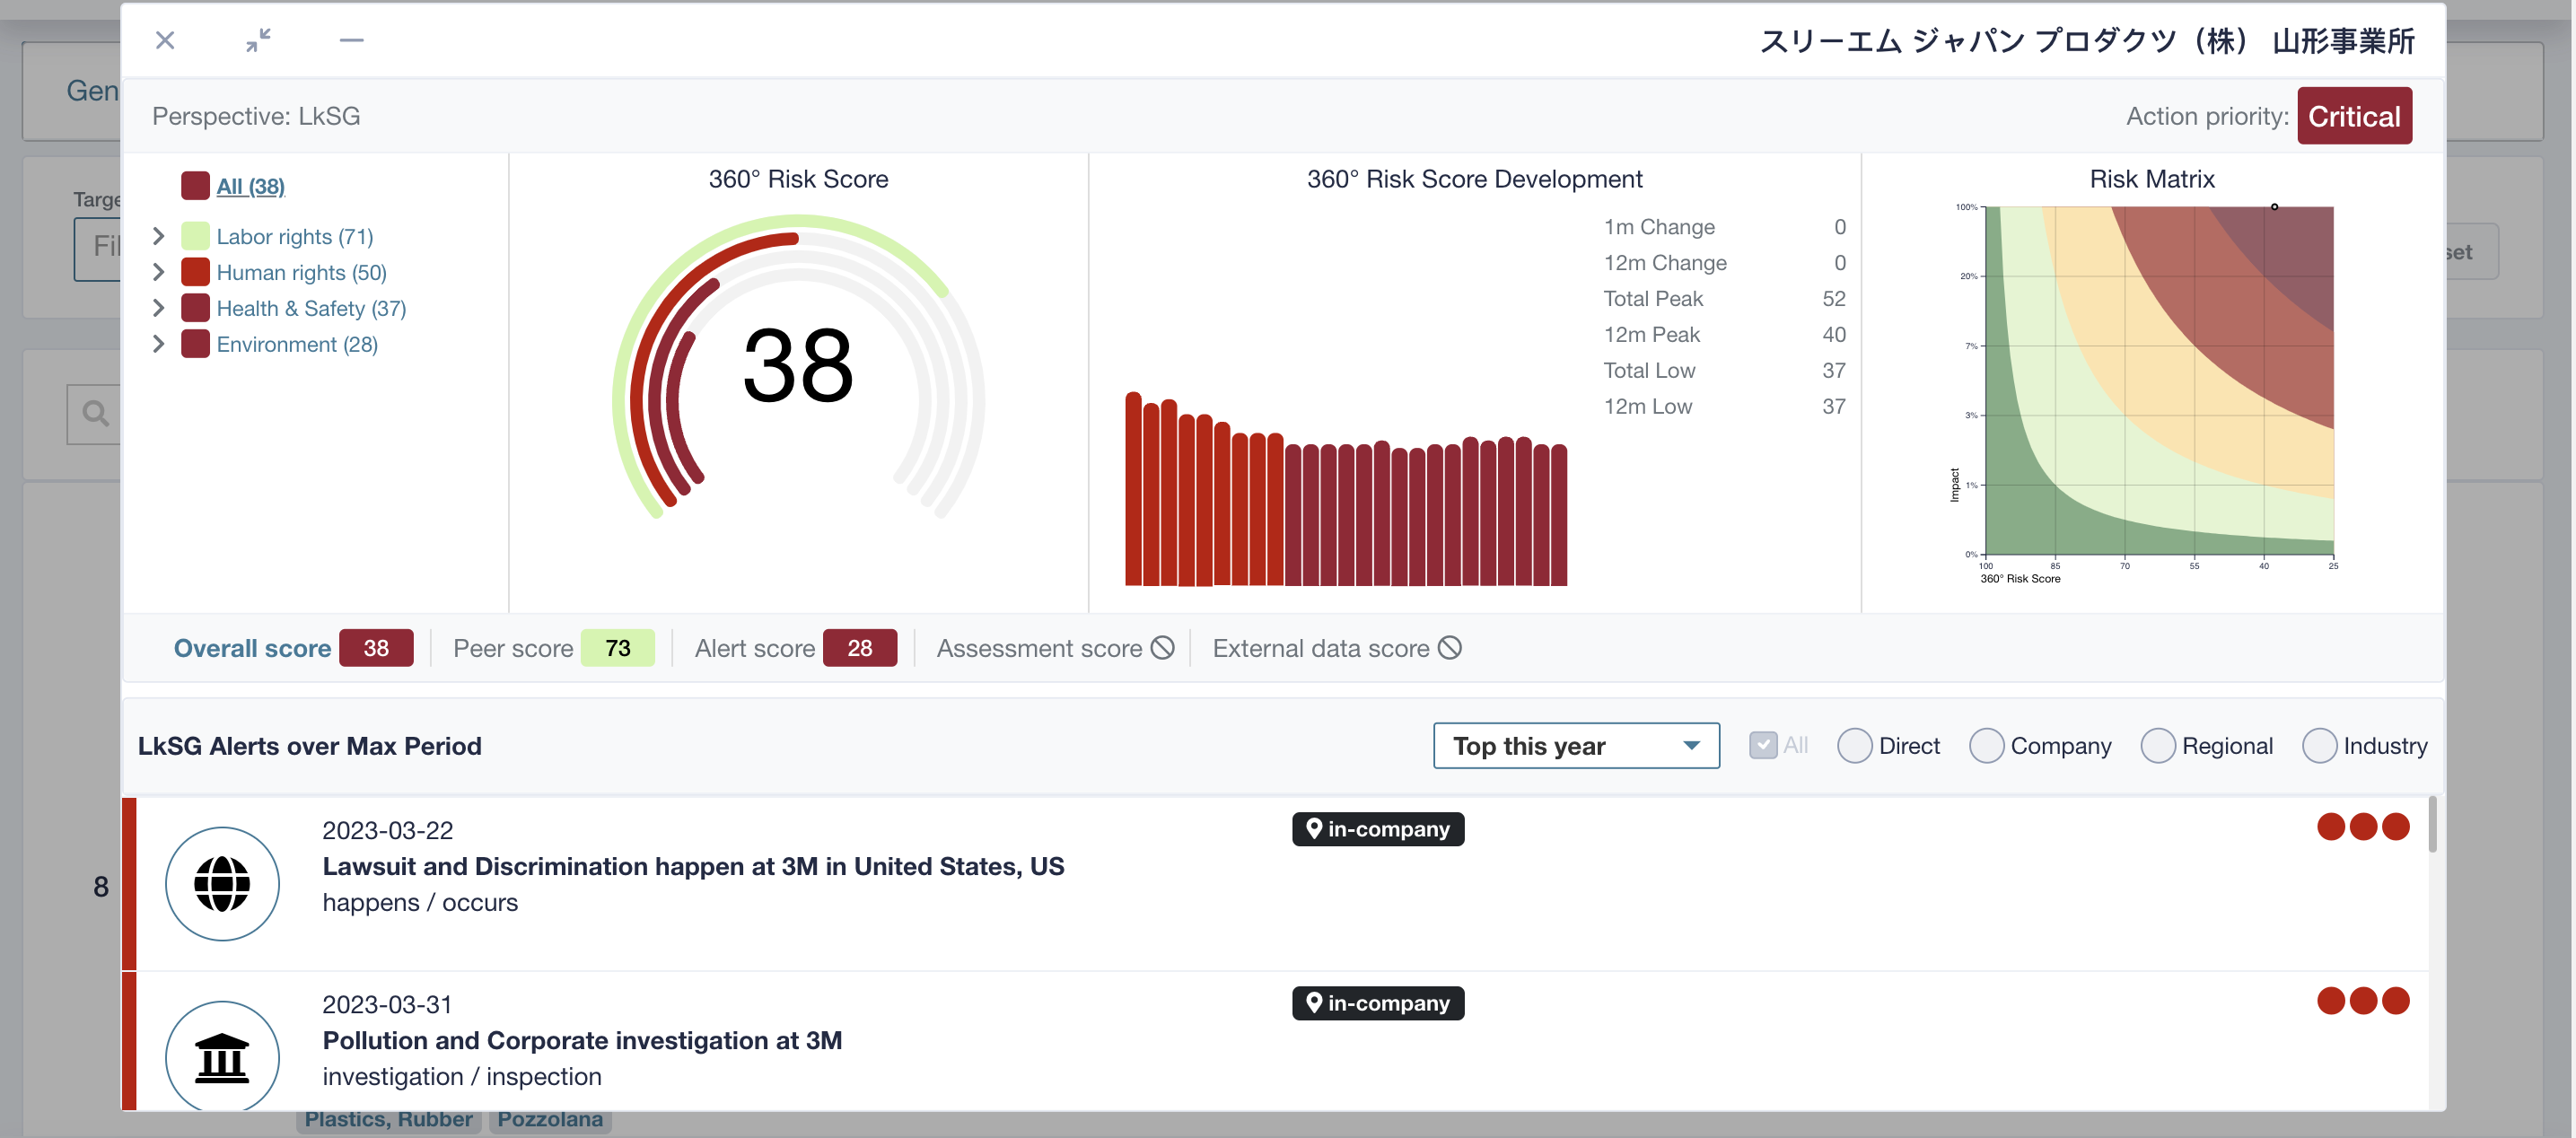
With a click on either the 360° score or the score of the individual categories, the respective alert history opens. This alert history shows which alerts were created in the past and how they affected the score.
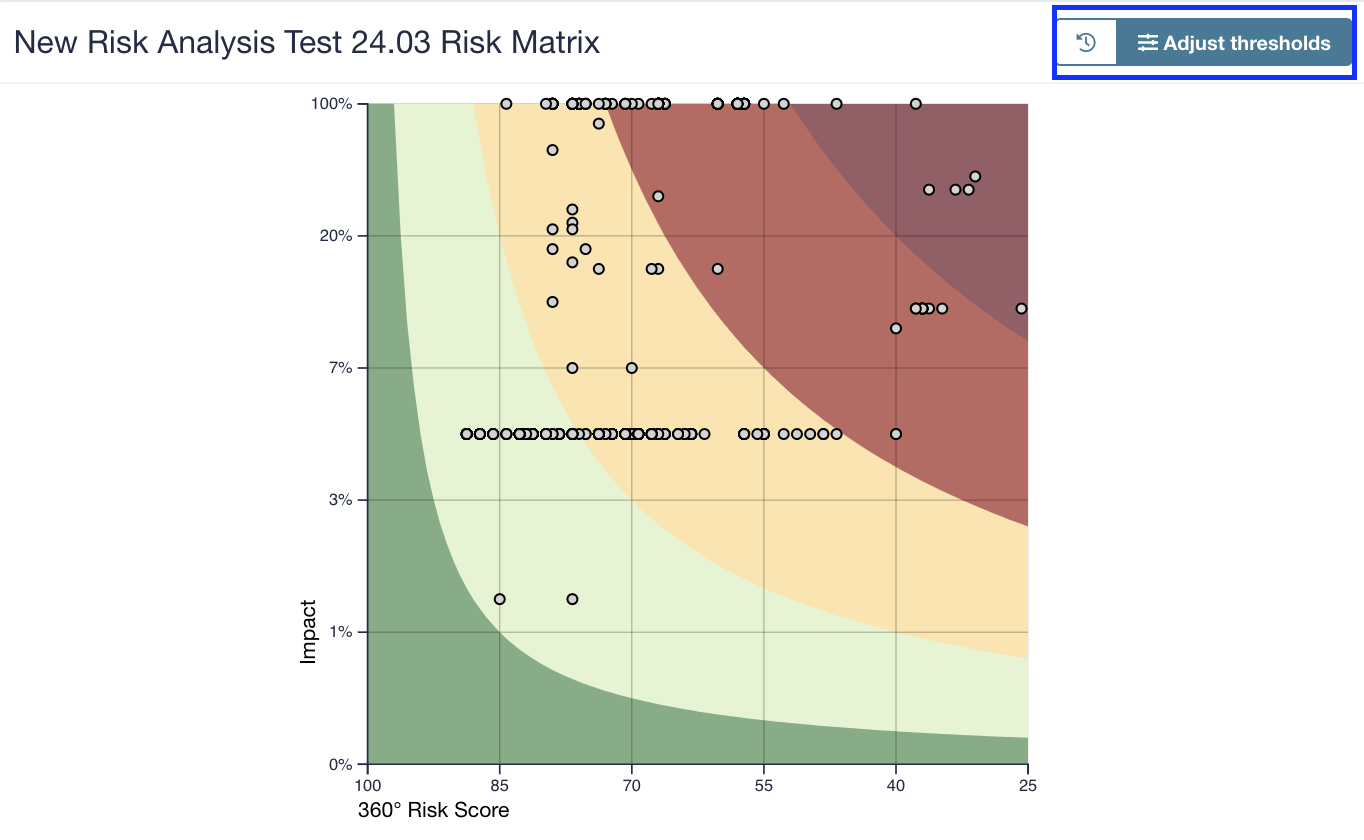
The risk matrix provides a graphic overview according to impact and 360° score. Each dot represents a supplier in the list. The colours of the diagram stand for the action priorities. No priority (green), low priority, mid priority, high priority, critical priority (dark red). It shows with one glimpse which suppliers are in which state of the analysis.
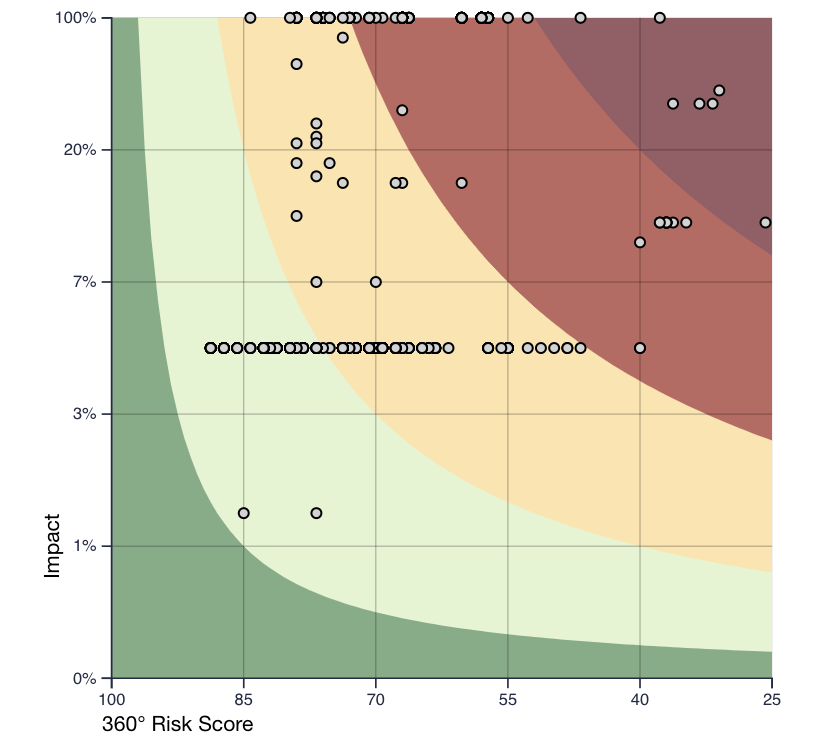
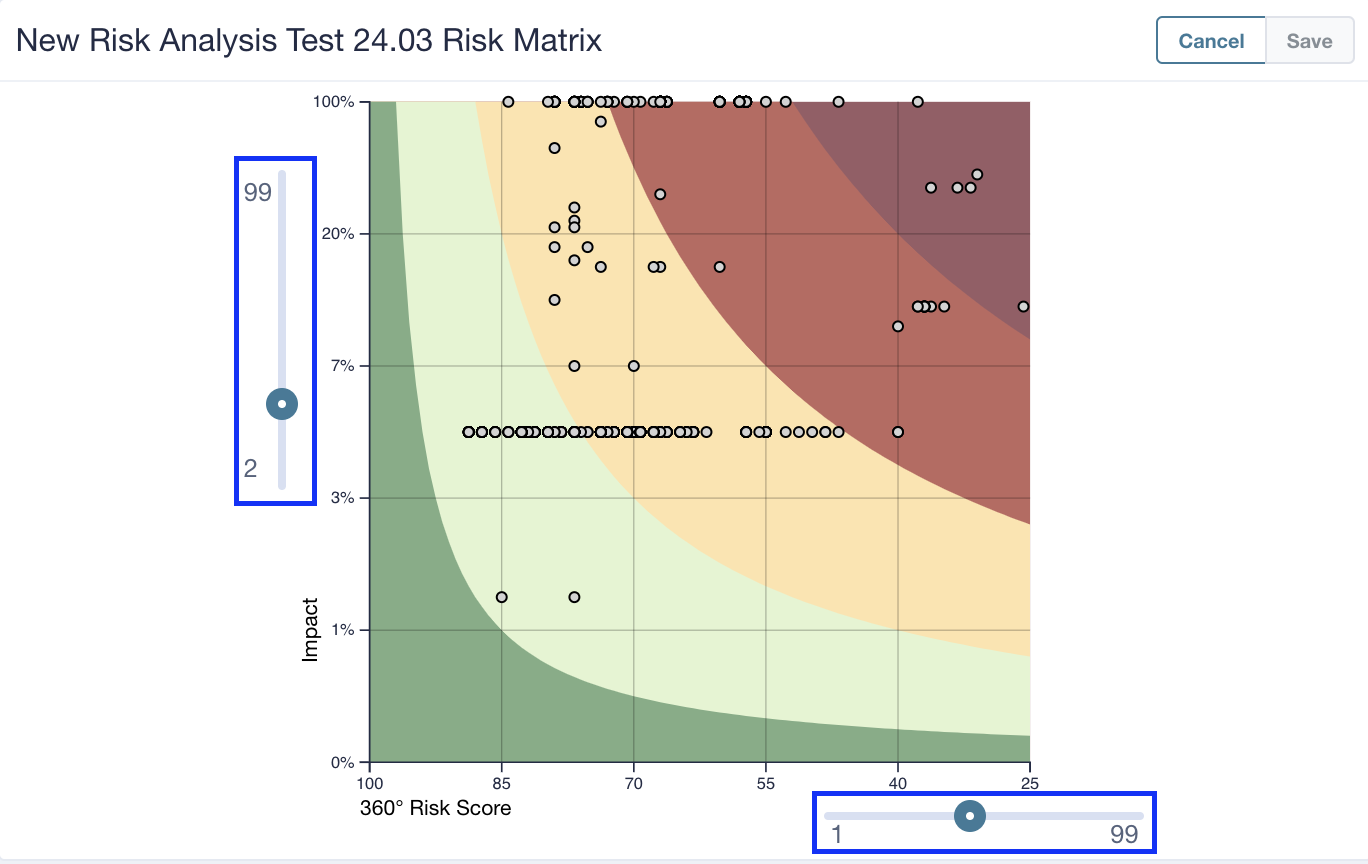
With the adjust threshold function, you can influence the scale of the axes and set it to your specific company preferences. With a click on the button, two scales appear next to diagram axes. By dragging the node up or down you can ease the scale or adjust it in a stricter way. On this way you can adjust the effect that the impact and 360° score have within the whole risk classification process. If the scales are adjusted the ranking in the list also changes according to the new setting.
Further there is the possibility to select multiple suppliers within the risk matrix diagram. Therefore, you can draw a rectangle across a specific amount of supplier you would like to mark. The selection will be shown in the ring diagram in an updated state and also highlighted in the risk matrix. In addition, the supplier List below will be updated with the selected suppliers. To clear the selected targets, click on the selection on the top left corner of the risk matrix.
4. Measures and Actions
This area allows you to plan and manage measure and actions. In addition to the already known key figures (risk classification, 360° risk score and impact) it gives an overview about actions and measures.
Actions can be planed for single suppliers or with a multiple selection. After a selection is done it's possible to plan certain actions via the menu " Add new Action".
There are different actions which are represented in different colours.
Preventive actions:
- Self assessment
- Statement request
- Desk audit
Remedial actions:
- Awareness training
- On-site Audit
- Offboarding
You can click on "Recommended Actions" to filter by recommendations.

By clicking on Add New Action you can create new Actions. Those can be Preventive or Remedial.

5. Reporting
The reporting section offers the possibility to download a summary of the analysis as an Excel file by clicking the export button.
